What Is Datadog, How It Works, and What It Does for IT Leaders
Datadog is a SaaS observability platform unifying metrics, traces, and logs. Learn how its agent, distributed tracing, and pricing work, and whether it fits your stack.

Datadog is a SaaS observability and security platform that unifies metrics, traces, and logs from your entire stack. This guide covers how the agent collects data, how distributed tracing and unified tagging actually work, the pricing model that catches teams off guard, and whether it fits your environment.
What Is Datadog?
Datadog is a SaaS observability and security platform that collects metrics, traces, logs, and security signals from across your infrastructure and applications, then correlates them in one place.
It sits in the observability platforms category and is built around a single principle: the data that tells you what is happening, why it is happening, and who it affects belongs in one system that speaks one language.
That language is tags. A latency spike on a host, the request trace that explains it, and the error log line that confirms it all carry the same service and env labels, so you can pivot between them in a few clicks instead of stitching together three separate tools.
In practice, Datadog:
- Runs a lightweight agent on your hosts, containers, and serverless functions that collects telemetry and ships it outbound to Datadog's cloud
- Ingests infrastructure metrics, distributed traces, and logs, and binds them together through a shared tagging model
- Applies machine learning through its Watchdog engine to baseline normal behavior and surface anomalies without manual thresholds
- Layers user experience monitoring, network monitoring, and cloud security onto the same dataset
- Presents everything through dashboards and correlated views, so an engineer can move from a metric spike to the exact log line that caused it
It is used heavily by organizations running cloud or hybrid infrastructure, microservices, and Kubernetes, where the moving parts have outgrown what host-by-host monitoring tools can track.
How Does Datadog Work?
Datadog splits into two halves. A collection layer runs inside your environment, made up of the Datadog Agent and language-specific SDKs. A SaaS backend stores, processes, correlates, and visualizes the data.
None of the analysis runs on your hardware, and the Agent only ever makes outbound connections, which removes a class of attack surface that on-premises monitoring servers carry.
1. The Datadog Agent: Collection at the Source
The Datadog Agent is open-source software, written in Go, that you install on each host or run as a container. It is the bridge between your systems and the platform, and it never stores data long term. It collects and forwards.
The Agent is built from a few cooperating processes:
- The Collector runs checks and gathers standard system metrics every 15 seconds.
- The Forwarder buffers payloads in memory and sends them to Datadog over HTTPS, so a brief network split does not lose data.
- DogStatsD receives custom metrics from your own code over UDP or a Unix socket, aggregating them locally so instrumentation adds no latency.
- The trace Agent collects distributed traces and is enabled by default.
- The process Agent collects live process and container information.
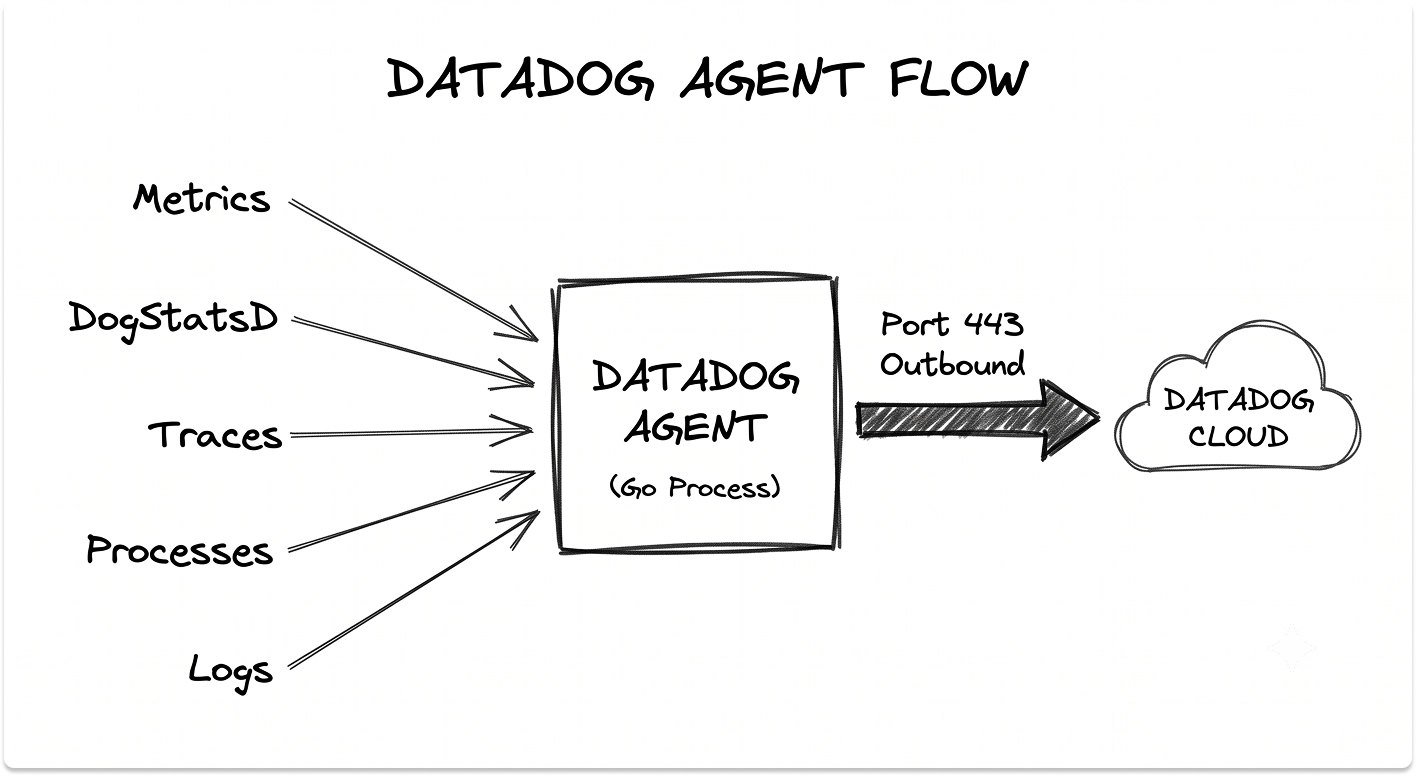
All traffic flows outbound over port 443 with SSL. In Kubernetes, a Cluster Agent sits between the node Agents and the API server, distributing checks so a single database or service check runs once rather than on every node.
If you are still deciding how to run those clusters, the trade-offs in EKS vs AKS vs GKE shape how the Agent gets deployed across them.
2. Metrics, Traces, and Logs: The Three Signals
Observability rests on three signal types, and Datadog collects each differently. Metrics answer what is happening; traces and logs explain why.
Infrastructure metrics arrive every 15 seconds from the Agent's checks and from more than 1,000 built-in integrations covering AWS, Azure, GCP, Kubernetes, databases, queues, and web servers. The AWS integration alone pulls metrics, events, and logs from over 90 AWS services.
Logs are collected by the Agent and shipped over an SSL-encrypted TCP connection, where processing pipelines parse and enrich them. Traces come from SDKs embedded in your application code and flow through the trace Agent. Each signal lands in its own product view, yet all three stay linked through tags.
3. Distributed Tracing and APM
Application Performance Monitoring is where Datadog earns its keep in microservice environments. A single user request can cross dozens of services, and a trace follows it across every hop.
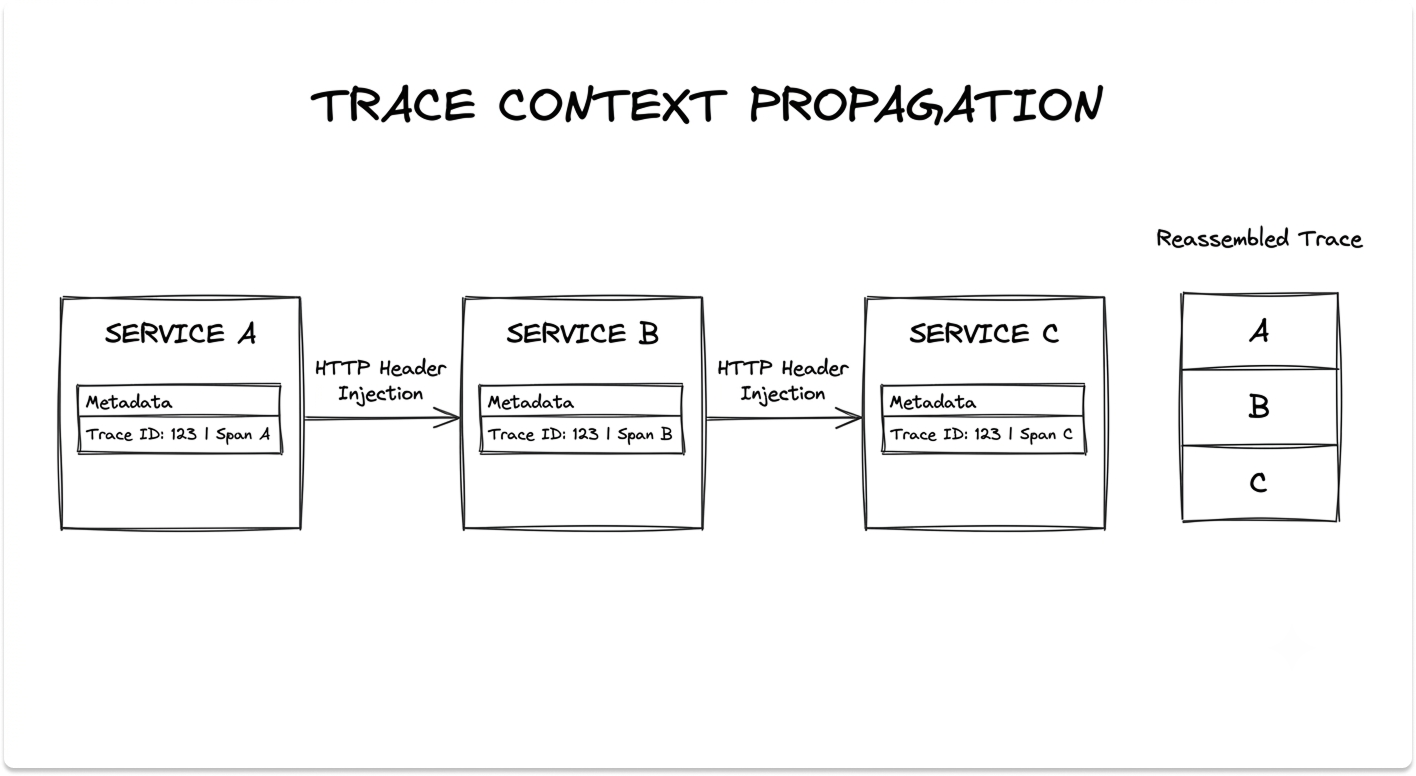
When a request enters your system, the SDK creates a trace with a unique trace ID and a parent span. Each unit of work inside that journey, an API call, a database query, a cache lookup, becomes a child span carrying the trace ID, its own span ID, timing, and error data.
Services connect through trace context propagation. As the request moves between services, Datadog injects the trace ID and parent span ID into HTTP headers, so spans from different services reassemble into one end-to-end trace, rendered as a flame graph that shows where time was spent and where an error originated.
You instrument applications two ways. Single Step Instrumentation installs the Agent and auto-instruments common frameworks with no code changes.
Custom instrumentation wraps specific business logic in spans when you need finer visibility. To control cost, ingestion controls set sampling rates per service, and retention filters decide which traces are kept for search.
4. Unified Service Tagging: How Correlation Actually Happens
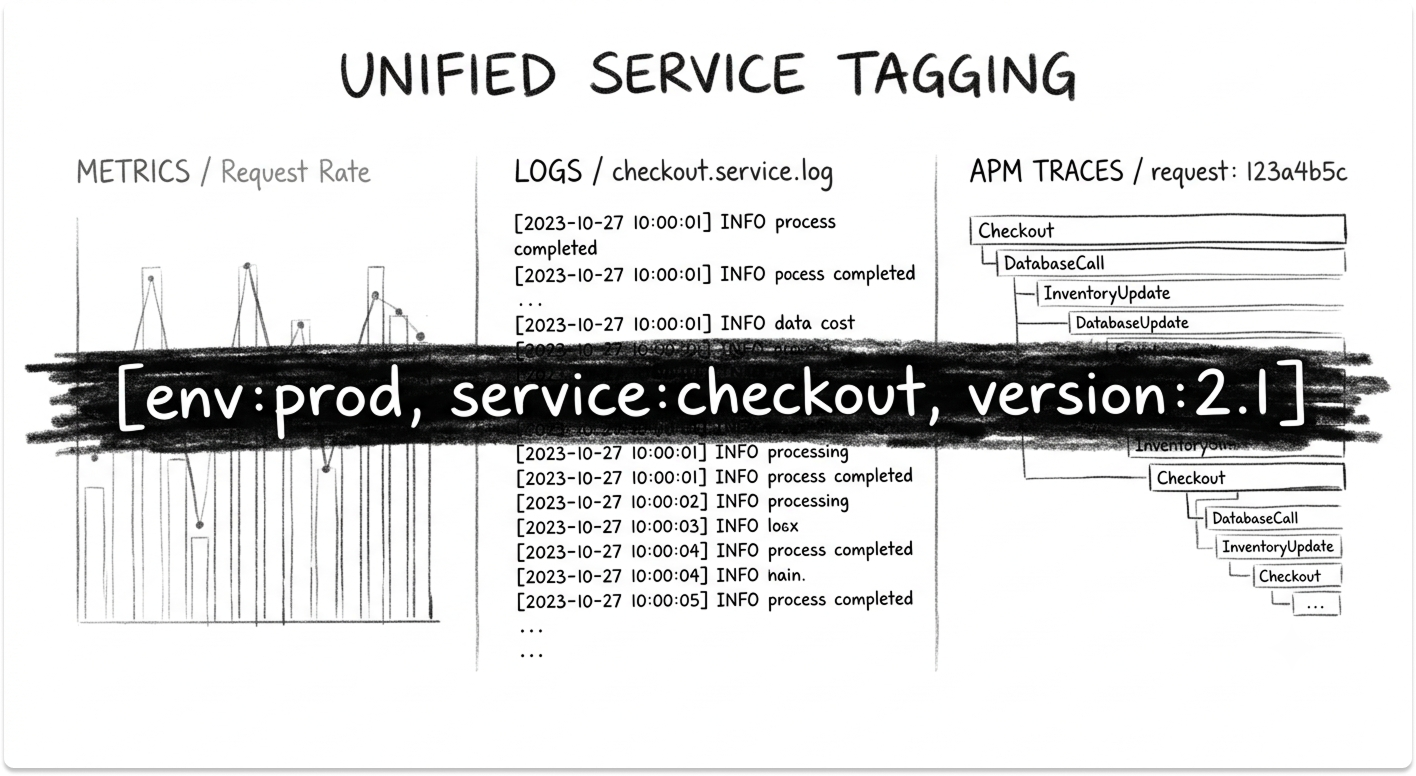
The correlation that makes Datadog useful depends on three reserved tags: env, service, and version. Unified service tagging applies these consistently across metrics, traces, and logs.
When a checkout service throws errors, those tags let you jump from the error-rate metric to the failing request trace, then straight to the log line, without leaving the platform or guessing which dataset belongs to which service.
Tags also flow in automatically from your providers, so AWS, Kubernetes, and Chef metadata like availability-zone and kube_namespace attaches to hosts and pods the moment they appear.
Get the schema right early, because inconsistent tags (env:prod versus environment:production) quietly break the correlation you are paying for.
5. Watchdog: The Machine-Learning Layer
Manual alert thresholds do not scale when you run thousands of containers that cycle up and down by the hour. Watchdog is Datadog's built-in AI engine, and it requires no configuration.
Watchdog computes a baseline of expected behavior, then flags deviations: abnormal error rates, latency on a database query, log volume spikes, new error patterns.
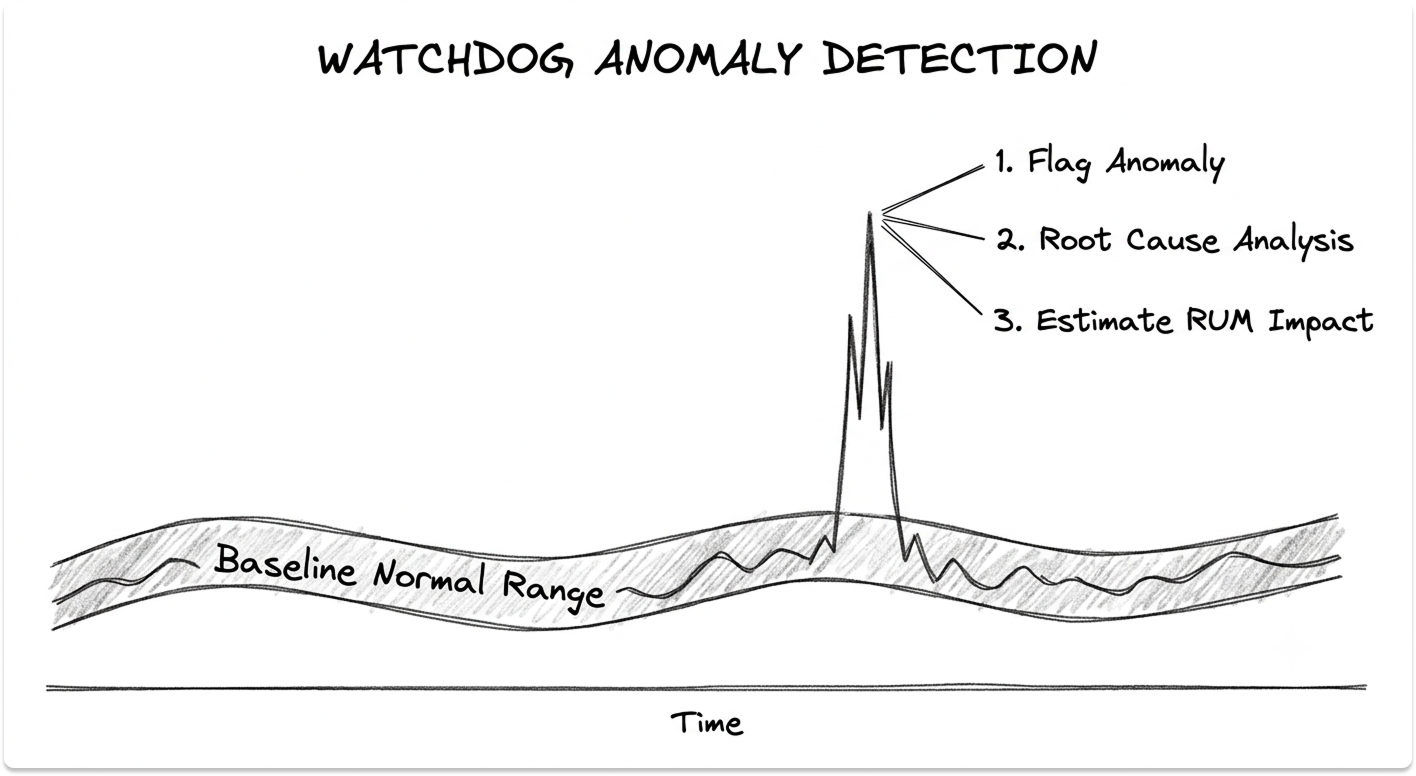
It needs at least two weeks of history to baseline and performs best with about six. The engine goes beyond detection. Root Cause Analysis traces causal relationships between symptoms to pinpoint where an issue started, Faulty Deployment Detection compares code versions to catch a bad release, and with Real User Monitoring present, Watchdog also estimates the impact on actual users.
This AIOps layer is where the major platforms diverge most, a contrast worth understanding through the LogicMonitor vs BigPanda vs Dynatrace AIOps comparison.
6. Ingestion Controls and What Leaves Your Network
Every signal flows to Datadog's cloud, so two questions matter: what leaves the building, and how do you keep the bill under control.
Sampling at the SDK and Agent level cuts trace volume before it ships, retention filters keep only the spans worth indexing, and the Sensitive Data Scanner redacts PII, PHI, and card data inside logs and spans before storage. These controls double as cost levers, which matters once you see how Datadog charges.
Datadog's Product Architecture: The Modules That Matter
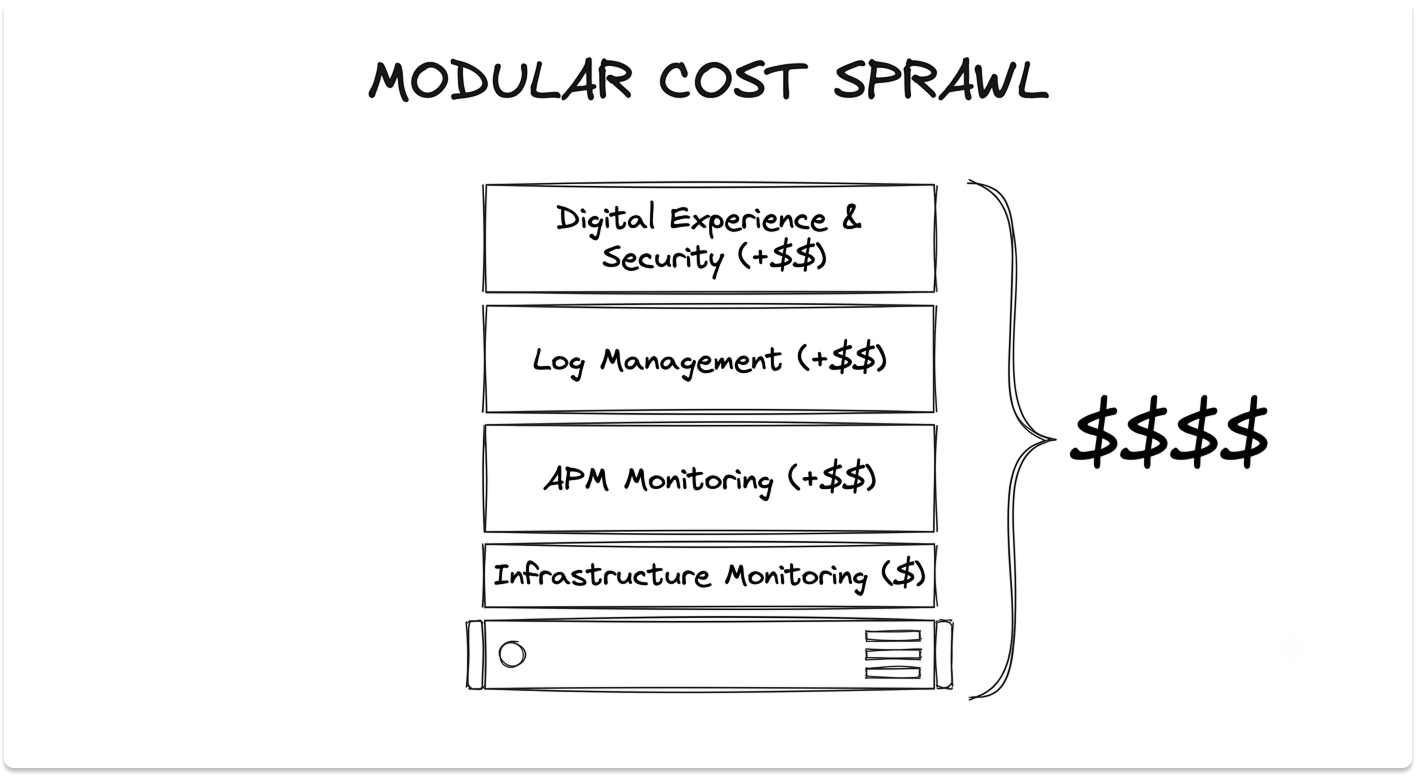
Datadog is not a single product. It is a suite of modules, each licensed separately and metered on its own unit. Most evaluation conversations collapse them into "Datadog" without clarifying which modules are in scope, and that is exactly where budgets go wrong.
Infrastructure Monitoring
What it does: Collects and visualizes metrics from hosts, containers, processes, and cloud services. This is the foundation layer that most other modules sit on top of.
Problems it replaces: Nagios and Zabbix dashboards stitched together by hand; blind spots when workloads autoscale; separate tools for on-premises and cloud metrics.
When you need it: Any environment with more than a handful of hosts, especially one spanning multiple clouds or moving toward containers.
Key capabilities:
- Host and container maps that visualize the whole fleet by tag
- More than 1,000 integrations with metrics collected out of the box
- Anomaly, outlier, and forecast alerts, including disk-fill forecasts days ahead
- The metric backbone that APM, Logs, and Security build on
Application Performance Monitoring (APM) and Continuous Profiler
What it does: Provides code-level distributed tracing from frontend through backend services to the database, with flame graphs, service maps, and trace-to-log correlation. Continuous Profiler adds method-level CPU and memory visibility.
Problems it replaces: Guesswork about which service in a request chain is slow; APM tools that do not link to infrastructure metrics; manual log-grepping to find a failed request.
When you need it: Microservice or Kubernetes architectures where "the app is slow" is no longer a debuggable statement.
Key capabilities:
- Auto-instrumentation through Single Step Instrumentation, no code changes
- Trace context propagation that reassembles end-to-end requests
- Ingestion controls and retention filters for cost management
- Universal Service Monitoring, which maps services even when uninstrumented
Log Management
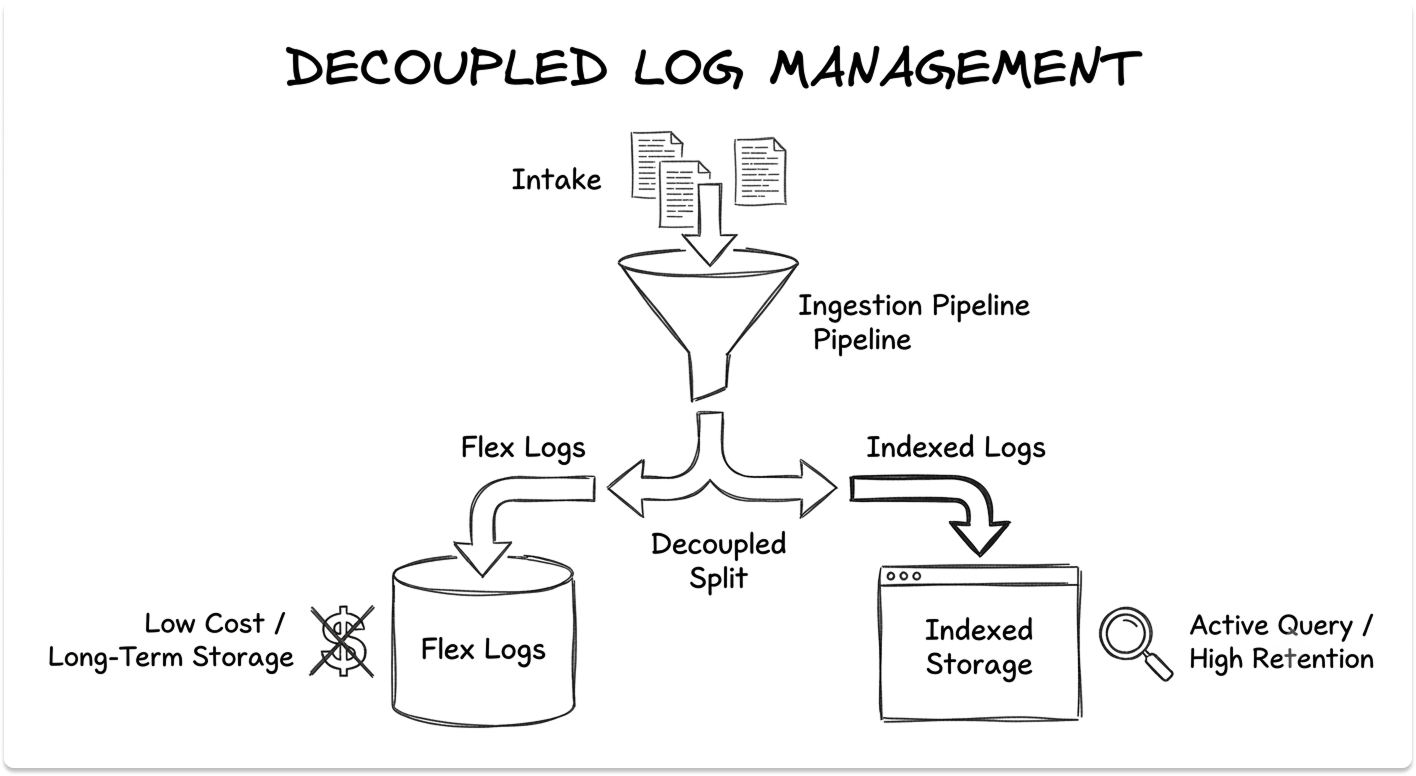
What it does: Collects, parses, and searches logs from every service, and lets you decouple what you store from what you actively query.
Problems it replaces: Self-managed ELK stacks that need a dedicated team; log data trapped on individual hosts; the cost of indexing everything when you query a fraction.
When you need it: Any team troubleshooting across distributed systems, or one under compliance pressure to centralize and retain logs.
Key capabilities:
- Processing pipelines with Grok parsers and attribute remappers
- Separate billing for ingestion and indexing, the single biggest cost lever
- Flex Logs for low-cost, long-term storage with on-demand search
- Watchdog log anomaly detection out of the box
Digital Experience Monitoring (RUM and Synthetic)
What it does: Real User Monitoring captures every user session in the browser or mobile app and correlates frontend behavior with backend traces. Synthetic Monitoring runs scripted API and browser tests from global locations to catch issues before users do.
Problems it replaces: Blind frontend performance, where backend metrics look fine but users see slow pages; reactive discovery of outages through customer complaints.
When you need it: Customer-facing web or mobile applications where user experience maps to revenue.
Key capabilities:
- Session Replay to watch and reproduce a user's exact experience
- Core Web Vitals and JavaScript error tracking down to the line of code
- API tests across HTTP, gRPC, SSL, DNS, TCP, and more
- Direct pivots from a RUM session to the backend trace behind it
Cloud Security and Cloud SIEM
What it does: Brings threat detection, configuration auditing, and vulnerability management onto the same telemetry the observability side already collects. Cloud SIEM analyzes logs for threats; Cloud Security covers misconfigurations, identity risks, and workload protection.
Problems it replaces: Security tools that operate in a silo from operations; stale point-in-time scans; the gap between spotting a threat and understanding its blast radius.
When you need it: Teams closing the distance between security and operations, or under audit pressure to prove continuous monitoring.
Key capabilities:
- Cloud SIEM powered by the same Log Management pipeline
- Configuration audits across hosts, containers, and cloud accounts
- Attack-flow tracing that uses observability data to find the affected resource
- App and API Protection against SQL injection, SSRF, and similar attacks
If a dedicated SIEM is the actual requirement rather than observability-native detection, weigh it against purpose-built options in the guide to the best SIEM vendors for IT leaders.
Here is how the modules map to common scenarios:
Most teams start with Infrastructure Monitoring, add APM when microservice debugging becomes painful, layer in Log Management, and extend into RUM, Synthetic, and Security as the platform proves itself.
What Datadog Offers IT Leaders
Datadog covers a lot of ground. For IT leaders weighing it, four areas matter most: consolidating tool sprawl, faster incident response, the cost model you have to understand before signing, and security on the same data as observability.
Consolidating Tool Sprawl Into One Platform
The case for Datadog often starts with the bill for everything it could replace. A typical mid-size estate runs separate tools for infrastructure metrics, APM, log aggregation, synthetic checks, and frontend monitoring, each with its own contract, agent, and learning curve.
Datadog folds those into one platform with one agent and one data model. The saving is real: fewer integrations to maintain, one place to train staff, and correlation that works because every signal shares the same tags.
The trade-off is concentration, which simplifies operations while strengthening the vendor's pricing leverage at renewal.
Faster Incident Response and Lower MTTR
The metric that justifies an observability platform is mean time to resolution. When a service degrades at 2 a.m., the question is how fast your on-call engineer finds the cause.
Datadog compresses that path. Watchdog surfaces the anomaly without a preconfigured alert, Root Cause Analysis points to the originating service, and unified tagging lets the engineer pivot from the alert to the trace to the log line in one interface.
Roughly 61 percent of enterprises run microservice architectures, and that is exactly where manual correlation across tools burns incident time. The caveat: this works when instrumentation is consistent.
A service that skips unified service tagging or runs without the trace SDK becomes a blind spot, and blind spots are where incidents hide. Where Datadog stops is paging and on-call routing, which is why teams pair it with a dedicated tool from the PagerDuty vs Splunk On-Call vs Grafana OnCall comparison.
The Cost Model You Have to Understand Before Signing
Datadog's pricing is modular and usage-based, and it is the part most teams underestimate. There is no single platform fee; your bill is the sum of every module you enable, each metered differently. The headline rates, current as of mid-2026:
- Infrastructure Monitoring: roughly $15 per host per month on an annual Pro plan, about $18 on demand
- APM: about $31 per host per month annual, and it cannot be bought standalone, so every APM host also needs an Infrastructure plan, pushing the real cost to roughly $46 per host
- Log Management: about $0.10 per GB ingested, with indexing billed separately near $1.70 per million events at 15-day retention
Three traps inflate the bill. High-water-mark billing meters hosts hourly and charges the 99th-percentile count for the month, so a few hours of autoscaling can set your rate for all 30 days.
Custom metrics overages kick in past the 100 per host that Pro includes, and one high-cardinality tag can generate thousands overnight. Product sprawl stacks Infrastructure, APM, Logs, RUM, and Synthetics into a per-host figure several times the headline.
The levers that work: commit to your baseline rather than your peak, decouple log ingestion from indexing so you store cheaply and index selectively, and audit custom metric cardinality. The median Datadog contract runs near $152,000 a year, so this is a budget line that demands forecasting.
Security and Observability on the Same Data
Most organizations run security and operations as separate disciplines with separate tools. Datadog's argument is that both need the same telemetry, so it should live in one place.
Cloud SIEM runs on the same log pipeline operations already feeds, Cloud Security audits configurations against live runtime context rather than stale scans, and the attack-flow view traces which resource a threat hit and who owns it.
For a lean team, that removes a tool boundary; for an organization with a mature security stack, judge the security modules on their own merits rather than adopting them by default.
See Which Datadog Products Best Suit Your Needs
Answer the questionnaire below and we'll recommend the right Datadog modules to start with.
Is Datadog Right for Your Environment?
Datadog is a strong fit for some environments and worth scrutinizing in others.
Datadog is likely the right conversation if:
- You run microservices or Kubernetes and "the app is slow" is no longer debuggable with host-level tools
- You pay for separate infrastructure, APM, log, and frontend tools and the integration overhead has become its own job
- Your environment spans multiple clouds and you need one correlated view across all of it
- Incident response time is a business metric and manual correlation across tools is where it bleeds
Evaluate carefully or consider alternatives if:
- Your environment is small or single-site and existing tools meet your needs without gaps
- Cost predictability matters more than breadth. New Relic and Grafana Cloud can run three to five times cheaper than Datadog at comparable scale.
- You have platform engineering depth and prefer a composable open-source stack you fully control
How Datadog stacks up against the main alternatives:
The deciding factor is rarely whether Datadog is a capable platform. It is whether your environment is distributed enough, and your appetite for usage-based spend predictable enough, that the breadth and correlation justify the cost trajectory over the next several years.
One pattern to avoid: signing a multi-year contract after a proof of concept at today's volume, then meeting the real bill once service growth multiplies your telemetry. The head-to-head detail sits in the Datadog vs New Relic vs Dynatrace APM comparison if you are narrowing a shortlist.
Evaluating observability platforms like Dynatrace, New Relic, or Grafana?
If you're evaluating Datadog, or trying to work out whether it's the right fit over the alternatives, our platform can help. Tell us your environment and priorities, and we'll match you with the vendors worth talking to.
FAQ
What is Datadog used for?
Datadog monitors infrastructure, traces application performance, centralizes logs, watches real user experience, and detects security threats, all from one SaaS platform. Teams adopt it to replace a patchwork of separate monitoring tools, shorten incident response in distributed systems, and get one correlated view across cloud, hybrid, and on-premises environments.
How does Datadog work?
A lightweight, open-source agent runs on your hosts, containers, and serverless functions. It collects metrics every 15 seconds, gathers logs, and forwards distributed traces from SDKs in your code, sending everything outbound over an encrypted connection to Datadog's cloud. The backend stores and processes the data, correlates it through unified service tagging, applies the Watchdog machine-learning engine, and presents it through dashboards and alerts. The agent only makes outbound connections; Datadog never connects back into your network.
What is the Datadog Agent?
The Datadog Agent is open-source software, written in Go, that you install on each host or run as a container. It combines a Collector that runs metric checks, a Forwarder that buffers and ships data over HTTPS, DogStatsD for custom metrics, a trace Agent for APM, and a process Agent. It collects and forwards telemetry without storing it long term, communicating outbound only over port 443 with SSL.
What is APM in Datadog?
APM, or Application Performance Monitoring, is Datadog's distributed tracing product. It follows a single request across every service it touches, building a trace made of spans. Trace context propagation injects identifiers into HTTP headers so spans from different services reassemble into one end-to-end trace, rendered as a flame graph. APM cannot be purchased standalone; every APM host also requires an Infrastructure Monitoring plan.
How does Datadog pricing work?
Datadog uses a modular, usage-based model with no single platform fee. Infrastructure Monitoring starts around $15 per host per month on an annual plan, APM around $31 per host per month (and requires a paired Infrastructure plan), and Log Management around $0.10 per GB ingested plus separate indexing charges. Costs climb through high-water-mark host billing, custom metric overages, and stacking multiple modules. Annual commitments cost less than on-demand rates, but you must forecast peak usage accurately to avoid overage charges.
What is Datadog Watchdog?
Watchdog is Datadog's built-in AI engine. It baselines normal behavior across your services and deployments, then flags anomalies such as abnormal error rates, latency spikes, and unusual log patterns, all without manual configuration. It also performs root cause analysis, detects faulty deployments by comparing code versions, and estimates user impact when Real User Monitoring is in place. It needs at least two weeks of history to establish a baseline and works best with about six.
How does Datadog compare to Dynatrace and New Relic?
All three converged on similar feature sets covering metrics, logs, traces, RUM, synthetics, and AI-driven anomaly detection. Datadog leads on integration breadth and developer experience. Dynatrace leads on automatic discovery and AI-driven root cause analysis through its Davis engine and OneAgent. New Relic uses per-user and per-GB pricing with no per-host charge, which tends to cost less for large fleets. The decision usually comes down to total cost of ownership at your scale and which data model your team prefers, since OpenTelemetry now makes instrumentation portable between them.