


What Is Technical Debt? The IT Leader's Guide to Measuring, Prioritizing, and Paying It Down
This guide covers how IT leaders can define, measure, prioritize, and reduce technical debt — with metrics, a remediation roadmap, and a 90-day action plan.

US organizations carry an estimated $2.41 trillion in technical debt annually. Stripe's Developer Coefficient found engineers spend 33% of their working week, roughly 13.4 hours, just servicing it.
McKinsey estimates technical debt represents 20 to 40 percent of the total value of most organizations' technology estates, before depreciation.
Debt doesn't accumulate in codebases. It accumulates in the decisions that created those codebases: the deadlines you signed off on, the roadmaps that left no room for remediation, the budgets that funded new features and ignored the cost of carrying forward what was already broken.
This guide covers how to define technical debt precisely, how to measure it in terms that translate to a board conversation, how to prioritize what gets fixed, how to build a remediation roadmap, and what AI changes about all of it.
What Is Technical Debt — A Definition That Actually Holds Up
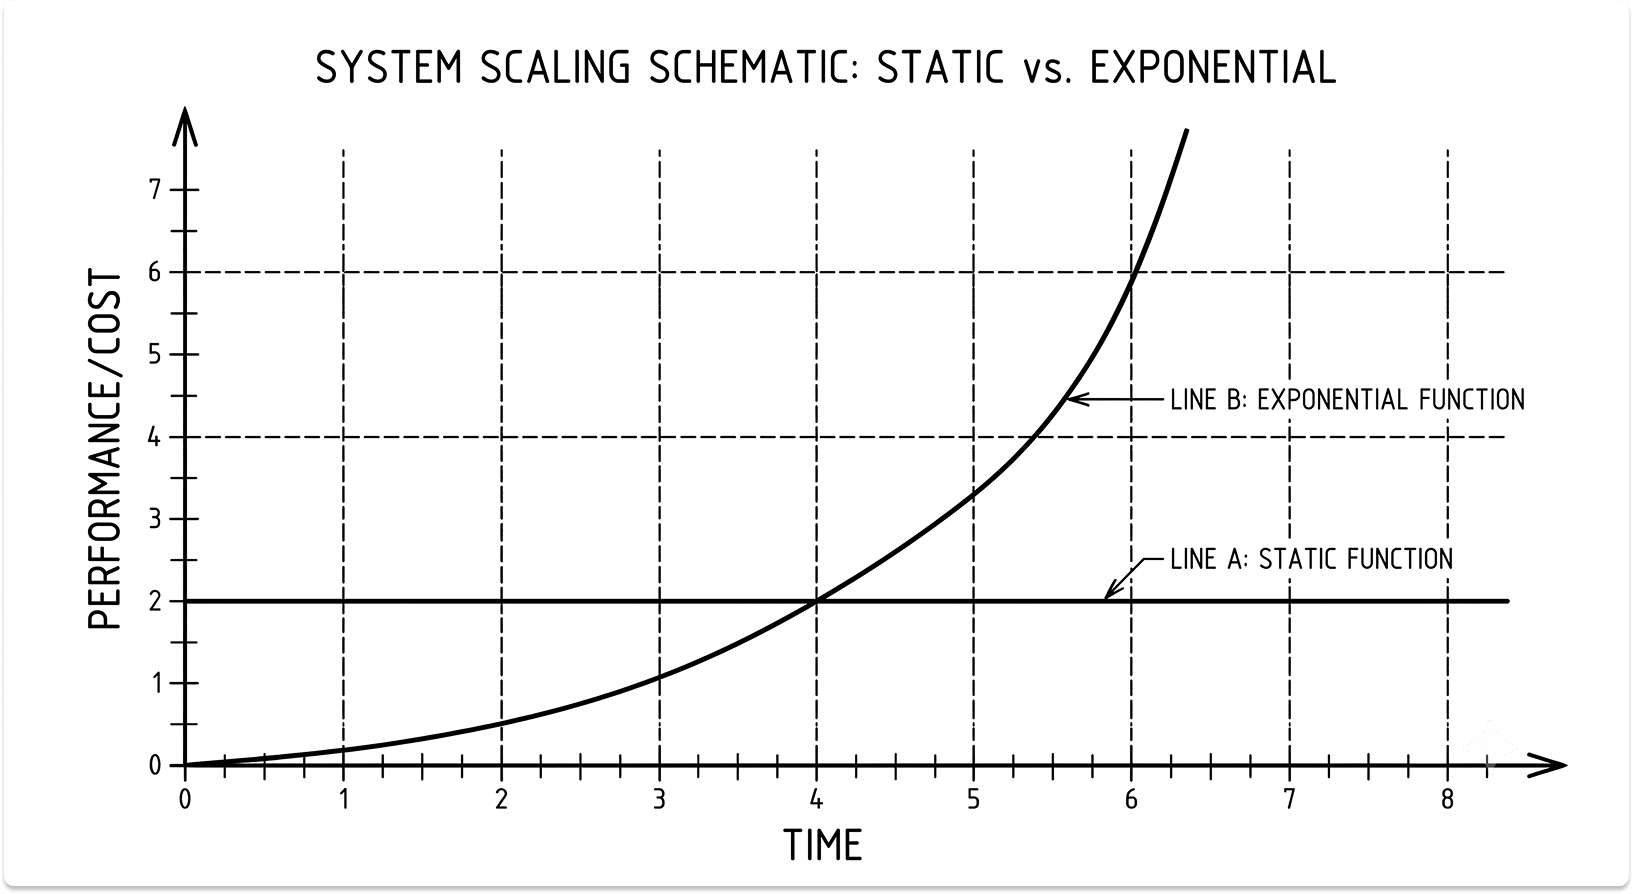
Ward Cunningham coined the term in 1992. The analogy: shipping code you know isn't right is like taking on financial debt. You get the short-term benefit of speed, but you pay interest on every future change that touches that code. The longer you carry it, the more every subsequent piece of work costs.
Martin Fowler added a critical refinement: the interest isn't time-based. You only pay it when you go back into that part of the system. A crufty but untouched module costs you nothing until the day you need to change it. This matters for how you prioritize remediation.
The term has been stretched to cover everything from slow CI/CD pipelines to an undocumented legacy API to a developer who left without writing a README. That vagueness is a management problem. You cannot triage what you cannot define.
The Three-Way Distinction IT Leaders Actually Need
Most practitioners use "technical debt" to describe three different things. Each requires a different response.
Technical debt is intentional, documented, and time-boxed. A deliberate trade-off made with a plan to fix it. This is the only kind that fits Cunningham's original definition.
Technical neglect is the majority of what teams call tech debt. It is known, it is accumulating, and nobody has scheduled a fix. This is a balance you have chosen not to pay. Treating it as debt (something you'll get around to) is how it compounds for years without resolution.
Dark debt is unknown and ungoverned. Legacy code written by people who have left. Undocumented integrations nobody mapped. AWS infrastructure built via click-ops during a growth sprint. It doesn't show up in any backlog. You find out it exists when it fails.
What Does Not Count as Technical Debt
Conflating adjacent problems with technical debt leads to a bloated backlog and misprioritized resources. Three things that are not tech debt:
- Bugs are defects and not really debt. Debt is structural impedance and the cost imposed on future development by a current design decision.
- Feature requests are scope, not debt.
- Software entropy is not negligence. A well-architected system running on a library with a newer version available is normal system aging.
Forrester's 2024 Modern Technology Operations Survey found practitioners now define tech debt primarily as out-of-date skills, obsolete hardware and software, and redundant IT systems. That shift should inform how you scope your audit.
Why Technical Debt Is a Leadership Problem, Not a Code Problem
The conditions that create technical debt don't originate in the engineering team. They originate above it. Three structural causes:
1. Deadline pressure without trade-off documentation
When IT leaders greenlight speed-first decisions without logging what was skipped, the shortcut becomes permanent. Nobody wrote down that it was a shortcut. Two years later, it's just "how the system works."
2. No formal ownership model
"Everyone owns quality" means no one does. Gartner is consistent on this: organizations without defined tech debt ownership accumulate debt at significantly higher rates. If no one is accountable for the debt inventory, there is no debt inventory.
3. Budget cycles that exclude debt
Protiviti found organizations spend an average of 30% of IT budgets managing the effects of technical debt. Accenture found only 15% allocate for it intentionally. That 15-point gap is invisible cost hiding inside your engineering capacity budget.
McKinsey puts the scale plainly: CIOs estimate tech debt represents 20 to 40 percent of the total value of their technology estate. Most of that wasn't created by engineers making poor technical decisions. It was created by leaders making speed decisions without a repayment plan.
The outcome of not addressing this:
- Feature delivery slows by 20 to 40% as engineers spend increasing time on rework and workarounds
- Incident response times grow as undocumented dependencies make root cause analysis harder
- Developer attrition increases: Erik Dietrich documents team infighting, atrophied skills, and turnover as direct consequences of high debt environments
- AI adoption stalls because new tooling cannot be safely integrated onto a fragile architecture
As Practical Engineering Management frames it: a company needs no heroes but strategists. One-time cleanup heroics that don't change the underlying governance conditions just reset the clock.
How to Measure Technical Debt: Metrics That Translate to Business Impact
Most teams measure technical debt with code-level metrics: cyclomatic complexity, code duplication, test coverage percentage. Those numbers mean nothing in a board conversation. IT leaders need metrics that connect to delivery speed, system reliability, and engineering capacity.
The Four Metrics That Matter at the Leadership Level
1. Technical Debt Ratio (TDR)
Formula: Cost to fix debt ÷ Cost to build the system
TDR makes debt visible as a financial ratio, not a code quality score. Track it quarterly. A rising TDR is a leading indicator that delivery timelines are about to deteriorate.
2. Code Churn Rate
The percentage of code rewritten within three weeks of its initial commit. High churn means your team is paying interest repeatedly on the same debt, not delivering net-new value. A churn rate above 25% in high-activity modules is a clear signal that debt is active rather than dormant.
3. Mean Time to Recover (MTTR)
Slow MTTR is frequently a structural debt symptom. If recovery from an incident that should take 20 minutes takes four hours, the delta is almost always debt: undocumented dependencies, brittle integrations, no runbooks for modified systems.
Track MTTR per system tier and look for the outliers. They will correlate with your highest-debt modules.
For teams evaluating incident management tooling alongside debt visibility, the PagerDuty vs. Splunk On-Call vs. Grafana OnCall comparison covers platforms that expose MTTR at the system level.
4. Engineering Time on Maintenance vs. New Work
Above 33% of developer time on maintenance is the red flag threshold.
Present this table to your CFO. It stops being an engineering concern immediately.
The 8% Rule
Structural and architectural flaws represent only 8% of all code issues, but they cause 90% of production reliability, security, and efficiency failures. Measurement should target this 8% and not the 92% of minor unit-level issues that static analysis tools surface first.
Quarterly developer surveys alongside analysis of 117 engineering log metrics found no single metric reliably predicts debt. Use at least three signals before making remediation decisions.
Going Deeper: Quantified Per-Component Scoring
For teams that want a heat map with a dollar figure attached to each system, TheFork Engineering published a formula worth implementing:
RemediationCost = AssessmentScore × Rule.EstimatedEffort × ComponentComplexity
Aggregate this by business capability. The output is a heat map that shows you exactly where to focus remediation resources — green (Low), yellow (Medium), red (High), black (Critical). Review it every four months with your architecture board.
The Four Types of Technical Debt — and What Each Demands From You
Martin Fowler's Technical Debt Quadrant is the most useful categorization framework available. Reframed for IT leaders:
Your structural goal: shift your portfolio from the bottom two quadrants into the top-left (deliberate, prudent) and eliminate the top-right through governance gates.
PMI's Disciplined Agile framework adds a specific requirement most organizations skip: accepting debt deliberately should require explicit sign-off from both the architecture owner and the product owner. Not a unilateral engineering call under deadline pressure but a documented decision with two named owners.
How to Prioritize Technical Debt: What to Fix First
The default prioritization mistake is ranking debt by technical severity. That produces a list engineers find satisfying and delivers minimal business value. The right ranking formula is:
Priority Score = Business Impact × Change Frequency × Remediation CostFowler's Change Frequency Rule
If a module hasn't been modified in two years and has no planned changes, the interest on its debt is currently zero. Leave it alone. Focus remediation on high-change areas. That is where debt compounds fastest and where clean code returns the most velocity.
Practical implementation:
- Pull commit history from your version control system for the last 12 months
- Identify the modules with the highest change frequency (top 20% by commit count)
- Cross-reference with known debt items
- Prioritize the intersection — high-change modules carrying known debt
Gartner's PAID Model
Structure your entire backlog into four buckets before writing a single remediation ticket:
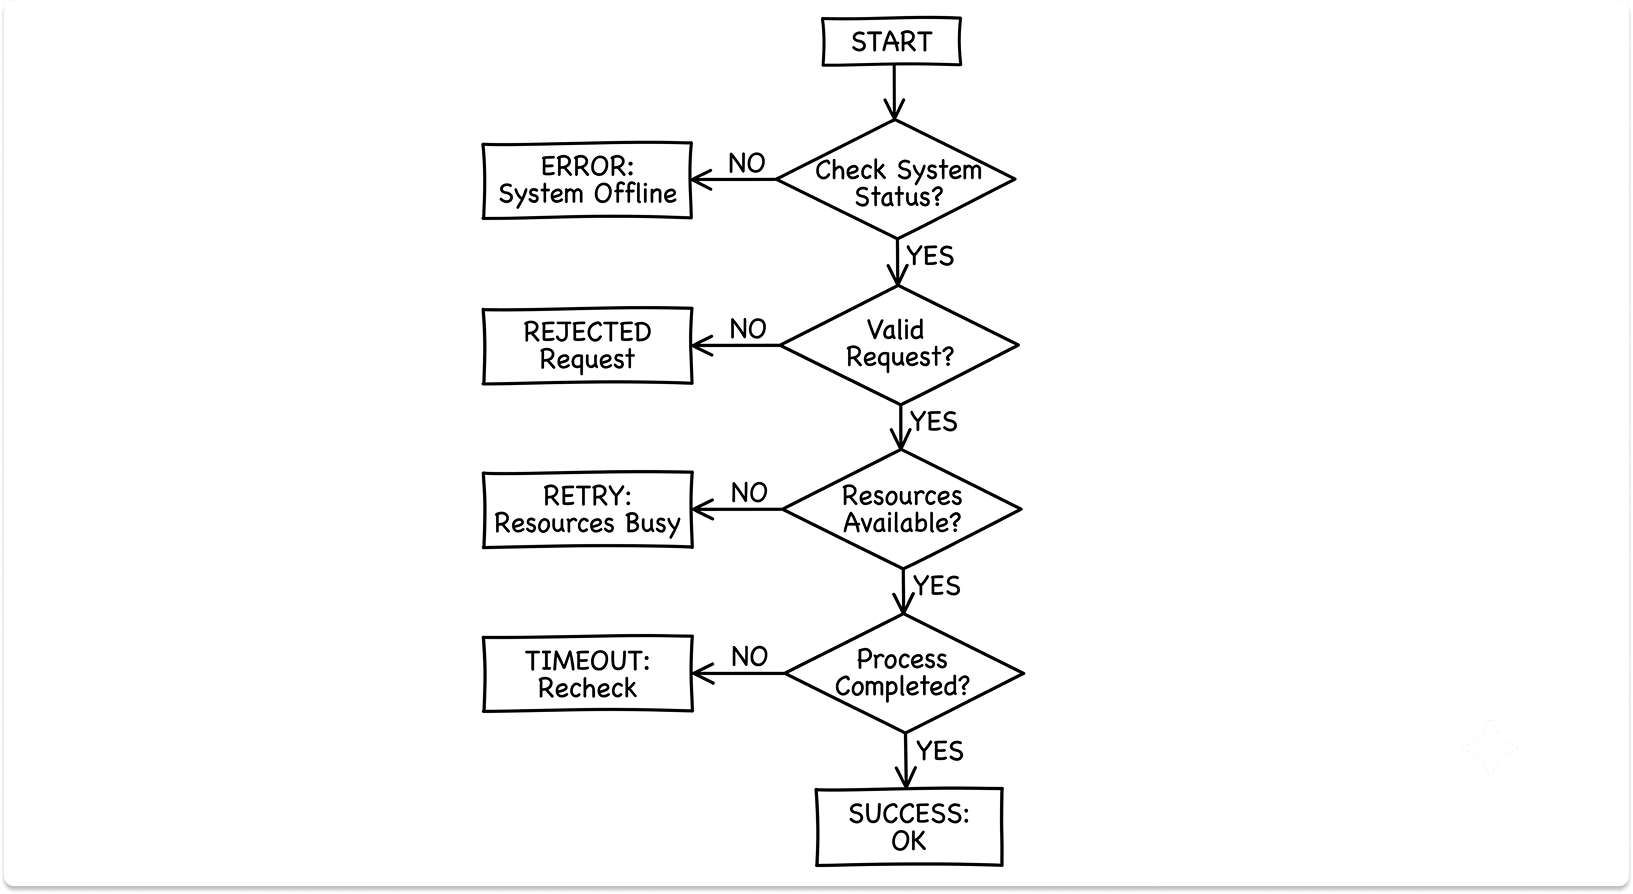
Triage Process: Step by Step
Step 1: Map each known debt item to a specific business application or capability — not a file or module name. Keep it at the system level.
Step 2: Score each item across four dimensions:
- Blast radius — if this fails, what breaks downstream?
- Change frequency — how often does this code get touched per quarter?
- Fix cost — estimated engineering days to remediate
- Strategic dependency — is any roadmap initiative in the next 12 months blocked by this?
Step 3: Cross-reference against your delivery roadmap. Debt blocking a revenue-critical initiative jumps the queue regardless of its technical severity score.
Step 4: Apply the 80/20 filter. 80% of tech debt's business impact comes from 20% of the codebase. Isolate that 20% before you write a single remediation ticket.
Expected outcome: A prioritized list of 10 to 20 high-impact debt items. That is a manageable, fundable remediation scope for a quarterly roadmap.
How to Create a Technical Debt Remediation Roadmap
A remediation roadmap is not a refactoring backlog. It is an executive artifact that shows where the liability sits, what it costs to carry it, and what the reduction plan looks like over the next four quarters.
Wayne Sadin's 5-Step CIO Process
Step 1: Conduct a full IT stack inventory
Catalogue every application and every piece of infrastructure. This step alone surfaces dark debt that no one in the organization has documented. Useful starting point: pull your IT asset management system records alongside your cloud provider's resource inventory. Cross-reference the two — the gaps are where dark debt lives.
Deliverable: A spreadsheet with every system, its owner, its age, its last major update, and whether it has open known issues.
Step 2: Calculate the cost to update each system
For commodity systems (general ledger, CRM), use vendor upgrade quotes. For custom-built systems, scope the engineering effort with your architecture team. Document explicitly: if a system belongs to a business unit being divested, or if remediation cost exceeds remaining business value, it becomes a divestiture or decommission decision.
Deliverable: A cost estimate for remediating each system, categorized as low/medium/high/critical.
Step 3: Play the risk card
Tie each high-priority debt item to a specific security or operational exposure. The average cost of a data breach in 2024 was $4.88 million (IBM). Structural debt is a direct contributor to breach probability. This is the argument that moves budget conversations from "nice to have" to "required."
Deliverable: A one-page risk card per critical system showing: known vulnerabilities, last security audit date, patch status, and estimated breach exposure cost.
Step 4: Quantify the opportunity cost
The most insidious cost of technical debt is the initiatives your current infrastructure can't support. Use gap analysis: list your planned roadmap for the next 12 months and map each initiative against your current technical capabilities. For every initiative that is delayed or blocked by debt, assign a revenue impact estimate.
Deliverable: A table showing roadmap initiatives, current technical blockers, and estimated revenue delay per quarter of slip.
Step 5: Have the difficult conversations
Bring the combined output of steps 1 to 4 to the C-suite and board. Frame it as risk and capital allocation. One recommended structure for the board communication:
- Slide 1: TDR trend over the last 4 quarters
- Slide 2: Engineering hours lost to maintenance (cost in dollars)
- Slide 3: Roadmap initiatives at risk and their revenue exposure
- Slide 4: Proposed remediation investment and expected return
Budget Allocation
Start at 20% of portfolio spend on debt reduction. Track it as an explicit line item.
A realistic allocation model by organization maturity:
Sprint Integration
Integrate debt work into regular sprints. Dedicated "debt sprints" are consistently the first work deprioritized under delivery pressure. A standing 20% sprint capacity reservation for debt is more durable than separate scheduled sprints.
Sprint integration model:
- Each sprint: 20% capacity reserved for debt items from the PAID backlog
- Each quarter: Architecture review of TDR trend; PAID model recalibration
- Each year: Full stack inventory refresh (repeat Step 1); board-level roadmap update
Handling Large Codebases
Do not attempt full rewrites. The strangler fig pattern — gradually replacing legacy components while keeping the system live — reduces risk and maintains delivery velocity.
Teams that migrate to cloud using a strangler fig approach typically see 30 to 40% faster remediation timelines compared to lift-and-shift approaches, because debt is addressed module by module during migration rather than carried forward.
Start with the modules you change most frequently. That is where Fowler's change frequency rule makes remediation ROI clearest, and where the CI/CD pipeline improvements required for safe incremental deployment deliver the most value.
One trap to call out explicitly: migrating a legacy system to cloud without addressing its debt produces a cloud-hosted legacy system. Every piece of debt you carry into the migration just costs more to fix later because it is now running on a platform you're also paying to operate.
How to Build the Business Case for Technical Debt Remediation
Developers talk about code quality. CFOs talk about risk and ROI. The IT leader's job is to translate. The Enterprisers Project is direct: technical debt is now such a sizeable off-balance sheet liability that it must be accounted for to the business.
Three Financial Arguments for the Board
Argument 1: The Engineering Tax
Stripe's research puts developer time spent on technical debt at 33% of the working week. That is 33% of your engineering payroll generating no new value.
Add to this the Shopify data point: IBM documents that Shopify dedicates 25% of its development cycles to addressing technical debt through structured "debt sprints." The organizations that manage debt intentionally spend less on it in aggregate than those that don't — because unmanaged debt compounds.
Argument 2: The Compounding Risk
Structural debt directly increases breach probability and severity. IBM's 2024 Cost of a Data Breach report puts the average cost at $4.88 million per incident. The risk argument has three parts:
- Unpatched dependencies in high-debt systems are the primary attack vector for known CVEs
- Undocumented integrations (dark debt) cannot be audited for compliance, creating regulatory exposure under GDPR, HIPAA, SOX, and similar frameworks
- Brittle systems have longer recovery times after breach — which multiplies the total incident cost
This is a risk disclosure framing, not an engineering footnote.
Argument 3: The Velocity Drag
McKinsey's research shows that organizations reducing technical debt systematically achieve 20 to 40 percent productivity gains. Gartner finds active debt management results in 50% faster service delivery.
Practical translation: if a revenue-generating initiative is currently sitting behind a 6-month delivery estimate, what does that estimate look like with a 3-month estimate post-remediation? Calculate the revenue impact of the 3-month difference. That is the ROI of your remediation investment.
The One-Slide CFO Brief
Four data points. One page:
- TDR trend over the last 4 quarters (line chart)
- Estimated engineering hours lost to maintenance per month (converted to dollars)
- Roadmap initiatives delayed and their estimated revenue impact per quarter of delay
- Proposed remediation investment and projected TDR reduction at 12 months
The SRE Error Budget Mechanism
Implement an error budget as a governance lever. The premise: each system has a defined reliability target (e.g., 99.9% uptime). When incidents caused by technical debt consume the error budget, new feature delivery for that system pauses until stability is restored.
This forces leadership to internalize debt risk as a direct constraint on delivery speed. For teams evaluating observability and reliability tooling to track error budgets, the Datadog vs. New Relic vs. Dynatrace comparison covers the platforms most commonly used to instrument this.
Technical Debt in the AI Era: The Risk IT Leaders Are Creating Right Now
GenAI is accelerating code production by an estimated 10x. Without governance, it creates technical debt at the same rate. AI code assistants can help identify and remediate debt, but AI-generated code accepted without architecture review introduces new, invisible debt at scale.
The transformation of legacy code maintenance by AI creates genuine remediation opportunity but that opportunity only materializes with the governance structure to direct it.
Three New Debt Vectors
1. AI-Generated Code Debt
LLMs produce syntactically correct, functionally plausible, architecturally unsound code. It passes review. It passes tests. It accumulates silently until a change in a related module exposes the structural fragility. The "author" has no accountability and no institutional memory.
What to do:
- Add an architecture review gate specifically for AI-generated code before it merges to main
- Require that AI-generated code contributions above a size threshold (e.g., 200 lines) pass a structural quality check against your defined rules
- Track AI-generated code separately in your commit history so TDR calculations can attribute source
2. Integration Debt
Rapid, ungoverned AI tool adoption creates a fragmented integration layer. Each tool added without architecture review is a new dependency that becomes tomorrow's dark debt. The teams adopting these tools are moving faster than architecture review processes can follow, by design.
What to do:
- Require a lightweight architecture review for any new AI tool integration, but documented answers to: what does it connect to, what data does it touch, who owns it
- Maintain a service catalog (modeled on TheFork's metamodel approach) that captures every AI tool as a technical component with an assigned capability owner
3. Skills Debt
Teams building competency in AI tooling are simultaneously losing depth in core systems knowledge. The engineers who understand your legacy systems are leaving. The AI tools don't understand them yet.
What to do:
- Before any senior engineer with legacy system knowledge leaves, run a documented knowledge transfer session besides README files but recorded walkthroughs of integration points and known fragility areas
- Treat institutional knowledge as a formal debt category in your inventory
What AI-Assisted Remediation Can Do Right Now
CAST Software prototypes show AI can automate 20 to 30% of necessary fixes, but only when grounded in structural software intelligence: call graphs, dependency maps, architectural context. Without that grounding, AI-generated fixes break system interactions at the integration layer.
A practical starting workflow for AI-assisted remediation:
- Run a structural analysis tool (CAST, SonarQube, or equivalent) to generate a dependency map of your highest-debt system
- Feed that map as context alongside the specific debt item to the LLM
- Review AI-suggested fixes against your architecture rules before merging
- Track automated vs. manual fix ratio quarterly — a rising automation rate is a signal your debt is becoming more tractable
The governance gate is straightforward: architecture review requirements for AI-generated code must be in place before AI code reaches production.
The debt created by ungoverned AI adoption in the next 18 months will be the hardest category to pay down because it will have no documented author and no clear remediation path.
Who Owns Technical Debt? Setting Up Accountability in Your Organization
The most common answer is "everyone." In practice, that means no one. A Reddit thread on systematically managing technical debt captures the operational reality precisely: "There is always something more important than reducing technical debt." That is a symptom of undefined ownership, not a property of engineering culture.
The Ownership Model
Putting Accountability Into Practice
Three changes that make ownership real rather than theoretical:
1. Add TDR to OKRs
If TDR reduction is in no one's objectives, it will not happen. Assign a TDR target to the Engineering VP for each half. Make it measurable: "Reduce TDR from 18% to 12% by Q4."
2. Require dual sign-off for new debt
Any deliberate decision to accept new debt — a deadline compromise, a skipped design review, a deferred refactor — must be documented with two names: the architecture owner and the product owner. Add this as a required field in your ticket system.
3. Publish the debt heat map quarterly
Make the TheFork-style capability heat map visible to all engineering leads and product managers. Visibility creates pressure. Teams that can see their capability's debt score relative to others move faster on remediation without being pushed.
Gartner's finding is worth repeating: I&O leaders who actively manage and reduce technical debt achieve 50% faster service delivery. That result is attributable to specific people making specific decisions. The question is whether those people are named in your organization.
90-Day Quick-Start Roadmap for IT Leaders
For organizations with no current formal debt program, this is a realistic starting sequence:
At 6 months: Rerun the TDR calculation and compare to baseline. Organizations that run this process consistently typically see TDR reduction of 3 to 8 percentage points within six months, which translates to a measurable improvement in delivery velocity and incident frequency.
Technical debt is a balance sheet problem that lives in your codebase. Treating it as an engineering problem — something the development team will eventually get around to — is how it reaches 20 to 40 percent of your technology estate's value before anyone brings it to a board meeting.
Start with measurement. Run a TDR calculation on your three most business-critical systems this quarter. Once you know where you stand, you have the basis for a business case, a roadmap, and the conversation with your CFO that your engineering teams have been trying to start for years.
Looking for vendors to help with tech debt?
Find vendors based on remediation priorities from a catalog of pre-vetted vendors on our platform. Match with vendors who fit and start conversations on your terms. It's free and private.
FAQ
What is technical debt in simple terms?
Technical debt is the future cost your organization pays for decisions that prioritized speed over quality. Every shortcut taken to ship faster — skipped design reviews, deferred refactoring, undocumented integrations — creates work that has to be done later at a higher cost. Like financial debt, it accrues interest: the longer you carry it, the more every future change that touches that system costs to build, test, and maintain.
How do you measure technical debt?
The four metrics IT leaders should track are: Technical Debt Ratio (TDR — cost to fix debt divided by cost to build the system), Code Churn Rate (percentage of code rewritten within three weeks of initial commit), Mean Time to Recover (MTTR), and the percentage of engineering time spent on maintenance vs. new work. Stripe's Developer Coefficient found the industry red flag threshold is 33% of engineering time on maintenance. No single metric is definitive — triangulate across at least three signals before making remediation decisions.
How do you prioritize technical debt?
Prioritize by business impact multiplied by change frequency, not technical severity. Debt in modules that haven't been changed in two years costs you nothing until you need to modify them — leave those alone. Focus remediation on high-change, high-criticality systems first. CAST Software's research shows 8% of structural flaws cause 90% of production incidents. Find that 8% in your highest-criticality systems before writing a single remediation ticket. Gartner's PAID model (Plan, Address, Ignore, Delay) is a practical framework for structuring the backlog.
Who is responsible for managing technical debt in an organization?
Ownership must be explicitly assigned across four roles. The CTO or Engineering VP owns the debt inventory and TDR metric. The CIO or IT Leader owns the budget allocation, the board-level business case, and governance gates for AI-generated code. The Product Manager owns prioritization trade-offs in each sprint. The Architecture Owner must sign off on any deliberate decision to accept new debt. "Everyone is responsible" is operationally equivalent to no one being responsible — which is why most debt backlogs never get addressed.
How does technical debt affect business performance?
Three measurable impacts: first, the engineering tax — Stripe found developers spend 33% of their time servicing technical debt, which is 33% of your engineering payroll generating no new value. Second, the compounding security risk — IBM's 2024 Cost of a Data Breach report puts the average breach at $4.88 million, and structural debt directly increases breach probability through unpatched dependencies and undocumented integrations. Third, the velocity drag — McKinsey research shows organizations that reduce technical debt systematically achieve 20 to 40 percent productivity gains, and Gartner finds active debt management delivers 50% faster service delivery.


