How to Fix Database Storage Performance: NVMe, Flash, and Tiering
Fix database storage performance the right way: diagnose I/O bottlenecks with iostat, isolate WAL/redo logs, and choose NVMe, flash, or tiering on $/IOPS, not $/GB.
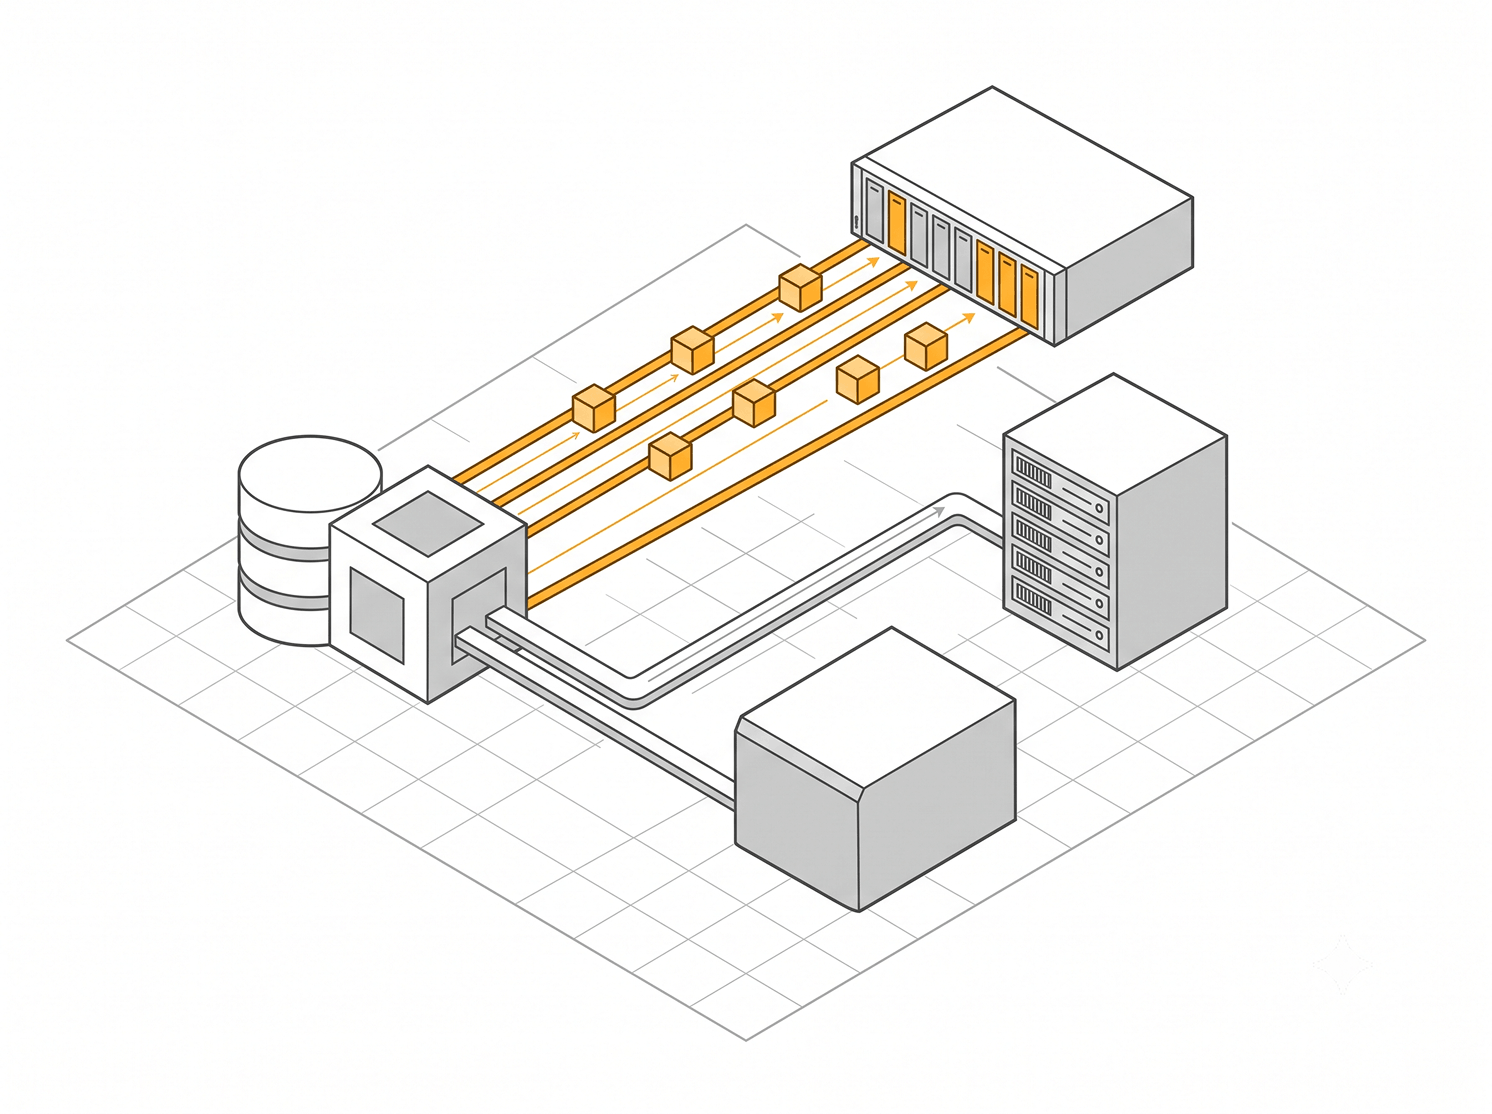
A query that returned in 40 milliseconds last quarter now takes 400. The overnight batch that used to finish by 5 a.m. slides to 7, then 8, and the finance team opens their reports to stale numbers.
Someone in the room says the disks are old and suggests buying faster ones. Maybe that is the answer. Often it is not, and the money gets spent before anyone confirms where the time actually goes.
Storage sits at the bottom of the database stack, so it absorbs blame for problems it does not own. Before you approve a purchase order, you need to know three things: whether storage is genuinely the constraint, which fix maps to your workload, and how to defend the spend when the CFO asks why $/GB went up. This guide walks that sequence in order.
Confirm storage is the bottleneck before you spend
The cheapest fix is the one you avoid because it was never storage to begin with. A slow database can be starved of memory, blocked on locks, or running a query plan that scans a table it should be seeking into. Each of those presents as latency, and none of them improves when you swap disks.
Start at the device. On Linux, iostat -x 1 gives you the columns that matter. Watch await, the average time each I/O takes in milliseconds, and %util, how busy the device is.

When both run high together, the device is the constraint and you have your answer. When %iowait is high but await stays low, the CPU is waiting on I/O that the disk is actually serving quickly, which points upstream to the query layer or the application, not the hardware.
Then check the database itself. A low buffer cache hit ratio means you are reading from disk for data that should be served from memory, and the fastest, least expensive fix is often more RAM, not faster storage.
Microsoft's guidance on isolating I/O bottlenecks on Linux makes the same point from the database side: I/O contention shows up as increased latency and reduced transactions per second, and you want to confirm it there before you touch the infrastructure.
One distinction decides everything that follows. IOPS, throughput, and latency are not interchangeable, and the metric you optimize depends on what your database does.
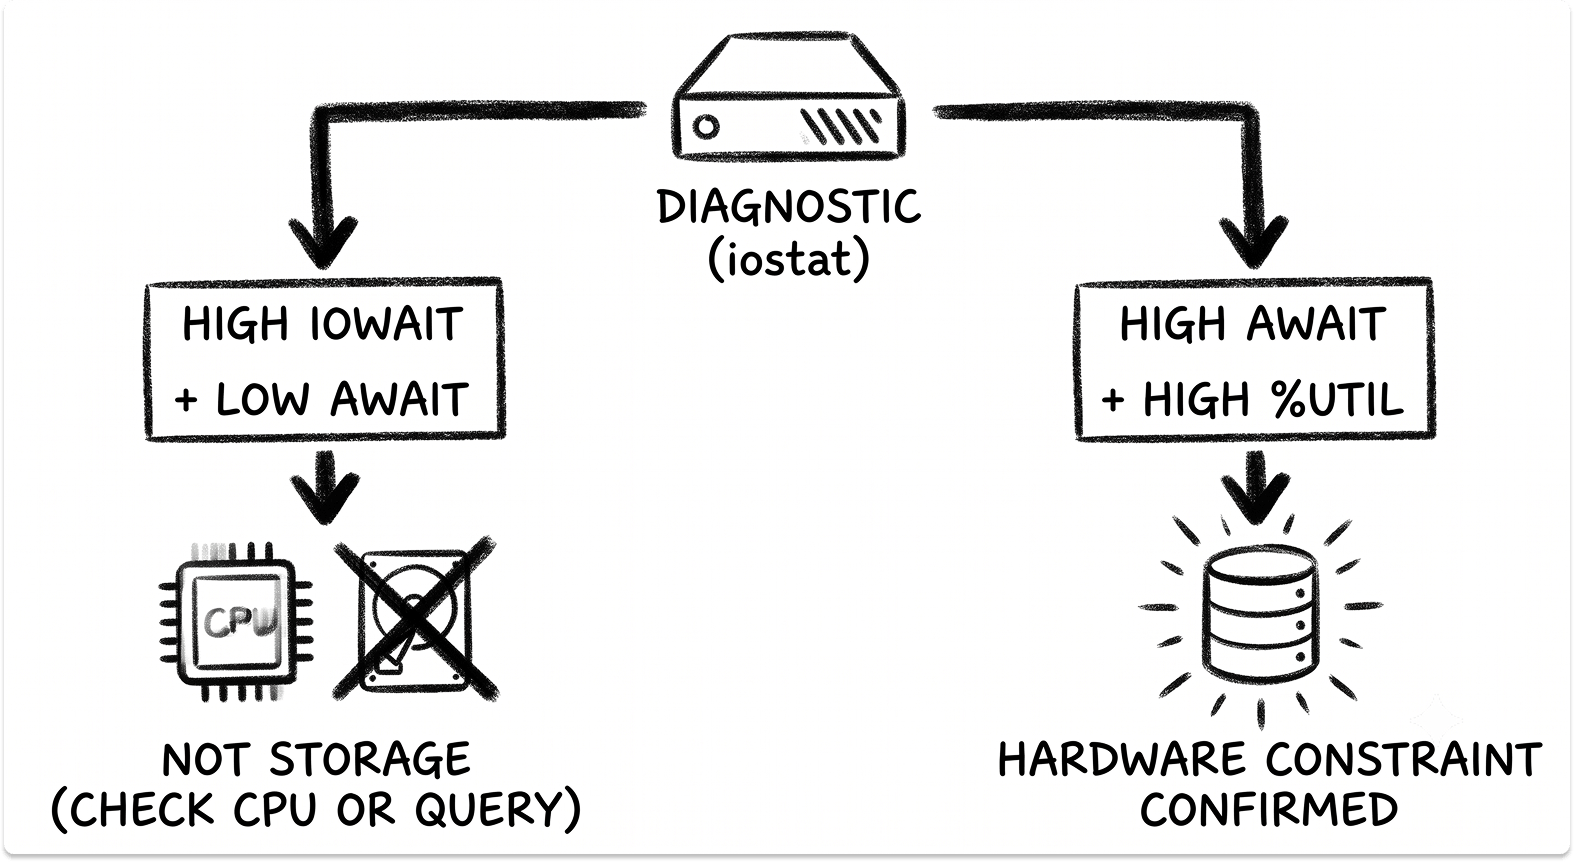
The number that quietly breaks service levels is tail latency, not the average. An average of 2 milliseconds can hide a 99.9th percentile of 47 milliseconds, and that long tail is what surfaces as the timeout a user actually notices. Track p99 and p999, not the mean.
Isolate WAL and redo logs
Before you price an all-flash array, look at where your write-ahead log lives. PostgreSQL calls it WAL, MySQL and MariaDB call it the redo log, Oracle calls it redo. In every engine it does the same job, and it behaves nothing like your data files.
Log writes are sequential and sit directly on the commit path. Data-file I/O is random. When both share one device, a burst of random reads gets in the way of the sequential log writes, and every commit waits behind them.
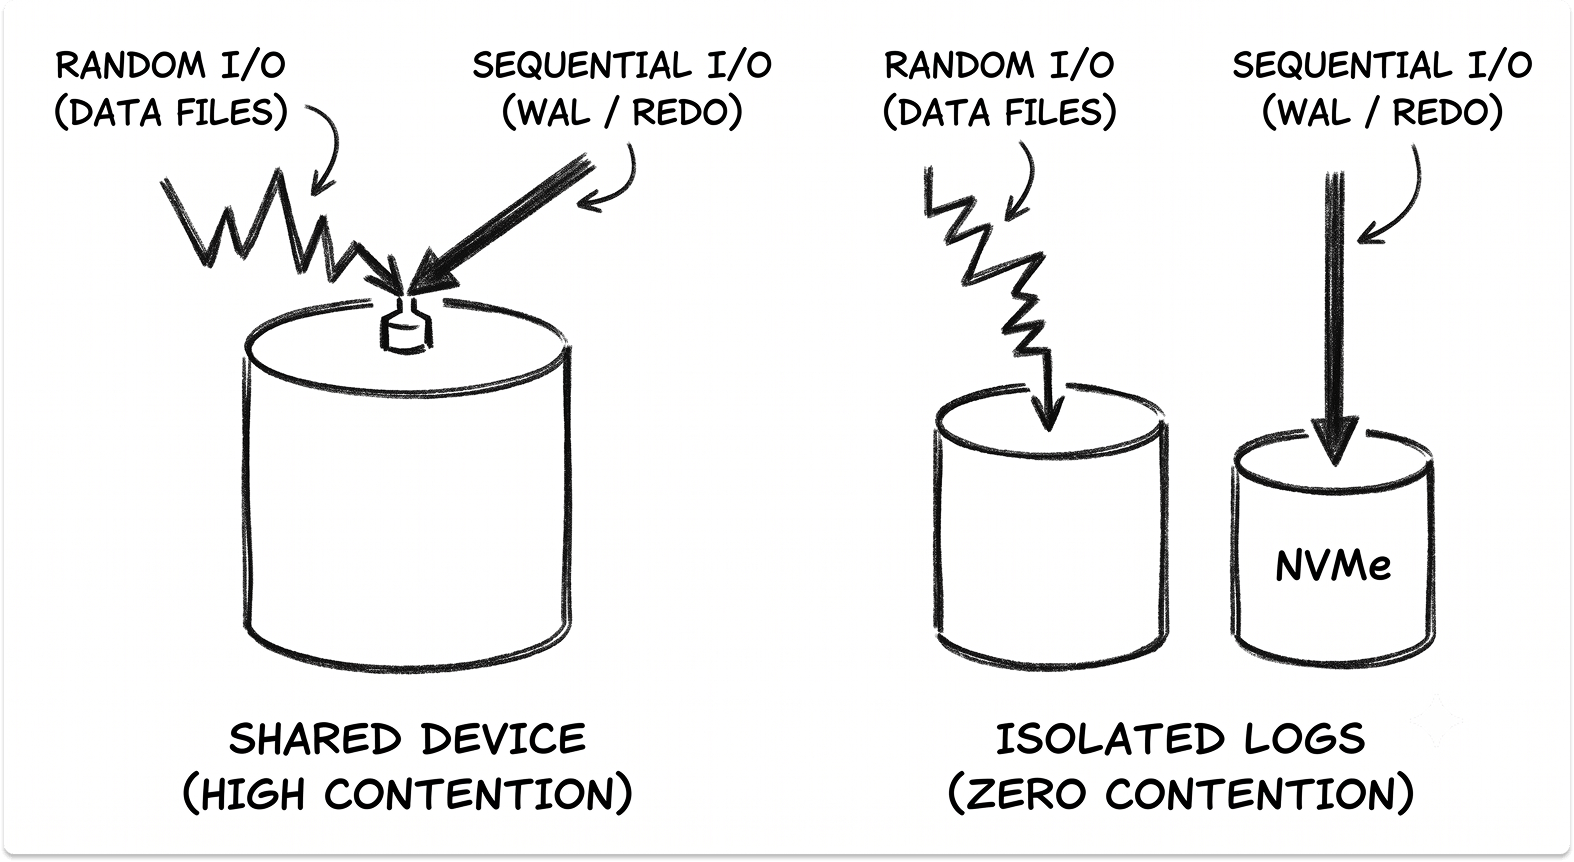
Oracle's own tuning guidance identifies poor log write latency from insufficient I/O bandwidth as the top issue it sees, and the symptom is familiar: transactions per second collapse under concurrent commits because everyone is queued for the same log resource.
Oracle surfaces this as log file sync waits; MySQL shows it as redo contention.
The fix is structural, not financial. Put the log on the fastest, lowest-latency device you have, on its own volume, separate from the data files.
In PostgreSQL that means relocating pg_wal; in MySQL, pointing innodb_log_group_home_dir at a dedicated volume; in Oracle, placing redo log groups on isolated low-latency storage.
NVMe versus SATA flash
When people say SSD, they flatten a distinction that decides your ceiling. The upgrade that matters is not spinning disk to flash. It is the interface and the protocol underneath it. SATA was designed for mechanical drives; NVMe was built for flash and talks to the CPU directly over PCIe.
The architecture explains the gap. SATA offers a single command queue holding 32 commands. NVMe offers up to 65,535 queues, each holding tens of thousands of commands, which is why NVMe keeps scaling as concurrency rises while SATA saturates and stalls.
Protocol overhead drops from roughly 125 microseconds on SATA to about 10 on NVMe. At the device level, NVMe random reads land around 20 to 70 microseconds, against 100 to 200 for a SATA SSD and 5 to 10 milliseconds for a hard drive.
Those differences compound into the interface ceilings you actually design against.
Benchmarks turn the ceiling into a decision. Testing MySQL under a TPC-C workload with 100 warehouses, comparing SATA RAID 10 against NVMe RAID 10, shows where the gain lands and where it lands hardest.
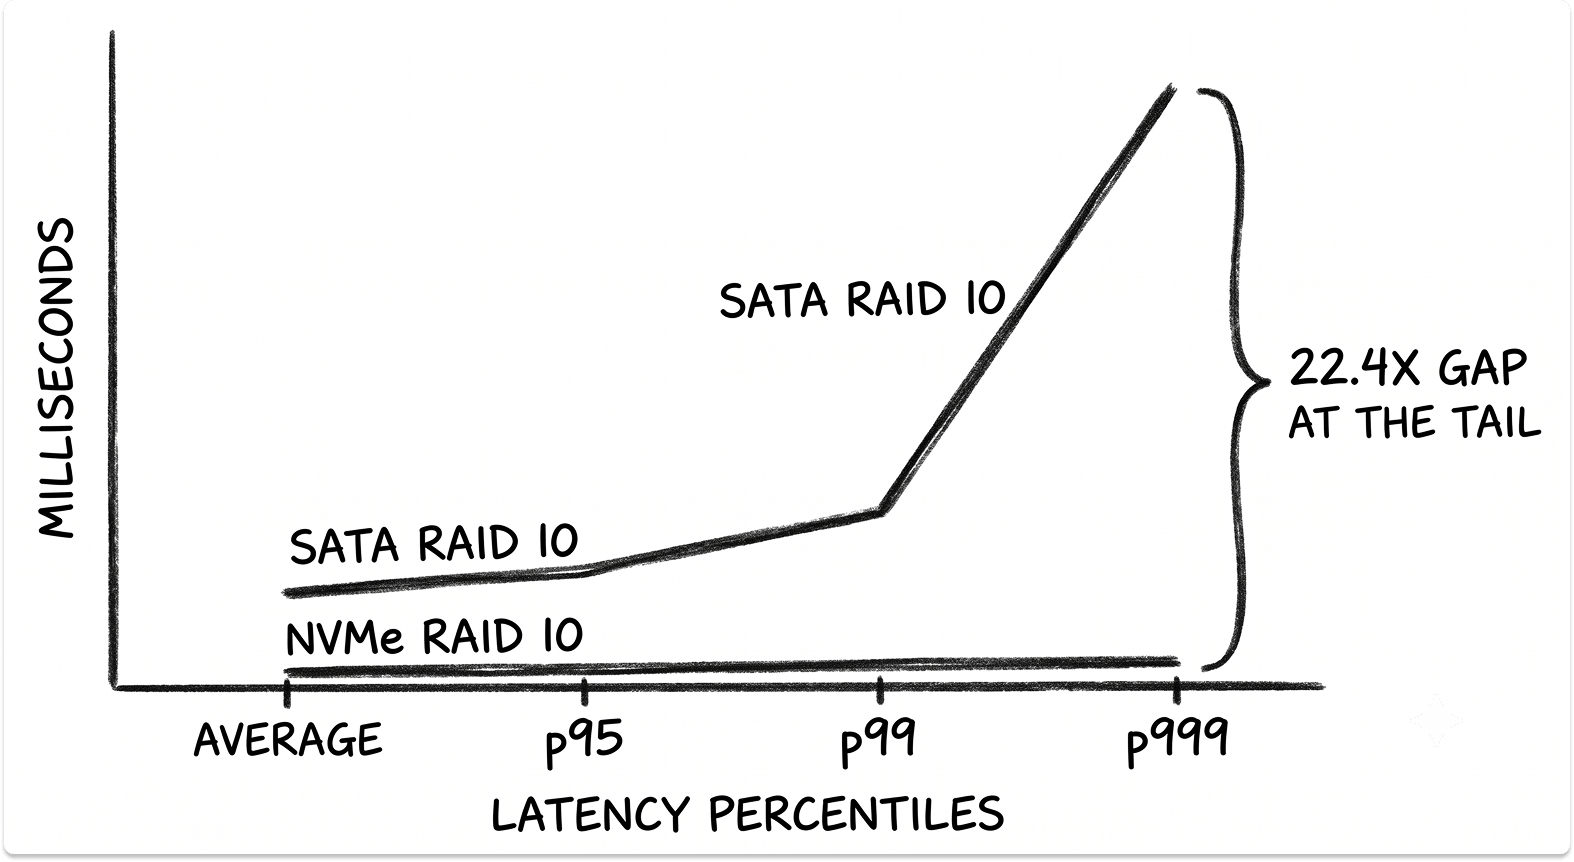
Notice the pattern down the column: the improvement grows as you move deeper into the tail. The average gets 3.8x better, but the p999 gets 22.4x better, which is the part your users feel.
The same testing shows why SATA cannot follow NVMe under load. At queue depth 32, SATA saturates near 95,000 IOPS and stops climbing. NVMe reaches 650,000 at the same depth and 920,000 at queue depth 64. Over a 24-hour sustained run, SATA p99 drifted from 12 to 28 milliseconds as the device worked under pressure, while NVMe held near 1 millisecond within 3 percent variation. If your problem is concurrency, and most OLTP problems are, this is the mechanism behind it.
Justify the cost in the language finance uses
The objection you will hear is that NVMe costs more per gigabyte, and it does, by roughly 78 percent in the same analysis, $0.080 against $0.045. That number is real and it is also the wrong unit.
Databases do not buy capacity, they buy operations. Measured on cost per IOPS, NVMe comes in about 3.8x better, and for workloads that need to stay under 5 milliseconds at p99, it delivers roughly 52 percent lower cost per transaction.
That reframe is the case you bring upstairs. You are not paying more for storage. You are paying less for each transaction the business runs, and you are buying down the risk of the missed deadline, the stalled report, and the timeout that reaches a customer.
Present the $/GB line honestly, then put the $/IOPS and $/transaction lines next to it. The decision defends itself.
Local NVMe versus network-attached storage
If your database runs in the cloud, it most likely sits on network-attached storage by default. That choice is easy to operate and it carries a ceiling on both latency and cost that you should measure before you accept it. Benchmarking PostgreSQL on local NVMe against managed network-attached services shows the distance under a TPC-C workload.
Local NVMe held a p99 roughly 1.9x lower than Aurora and 7.7x lower than RDS, and on analytical TPC-H queries it ran 2.4 to 3x faster. The cost side is starker.
The same analysis notes that about 2.5 million IOPS from a local NVMe drive costs on the order of $600, while pushing the same 2.5 million IOPS through a managed network service runs into the range of $1.3 million per month. For I/O-heavy databases, that gap is the whole argument.
Local NVMe has a real tradeoff. You give up the easy scaling and management that made network storage attractive. NVMe over Fabrics is the middle path. NVMe-oF extends the same low-latency NVMe command set across a network over TCP, RDMA, or Fibre Channel, which lets you separate storage from compute and scale them independently without paying the traditional latency penalty of network-attached storage.
NVMe over TCP has gained ground because it runs on standard Ethernet, so you do not need specialized adapters to adopt it. If you want flash-level performance and the operational flexibility of disaggregated storage, this is the topology to evaluate.
Storage tiering: match data temperature to media
Not every byte deserves your fastest media. Tiered storage classifies data by how often it is accessed and places it accordingly, which controls cost without slowing the hot path.
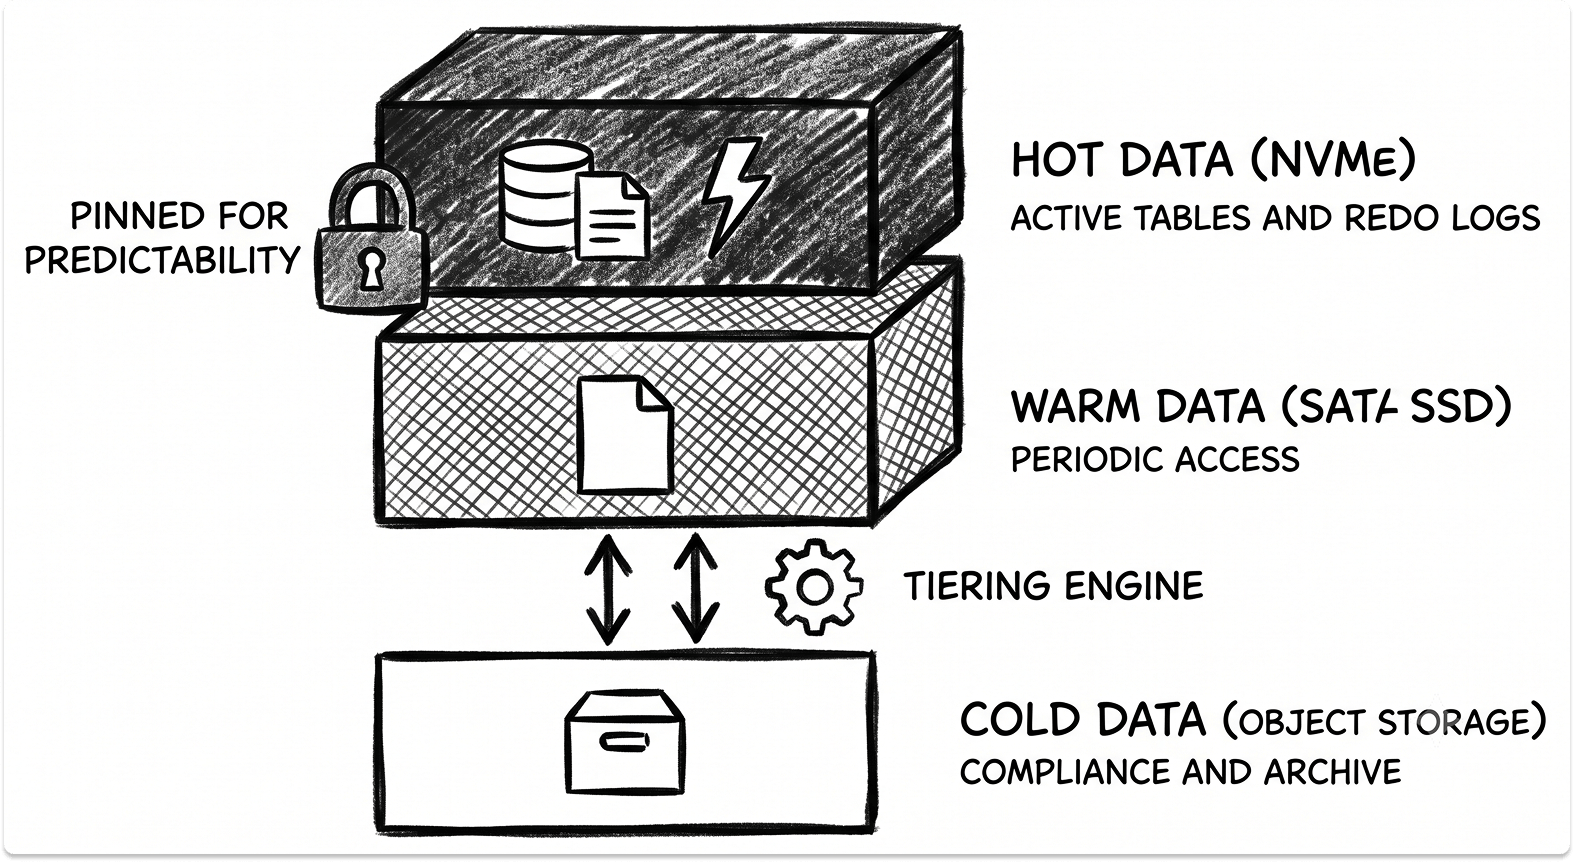
Automated tiering engines watch access patterns and move blocks between tiers by policy. That works well for general-purpose storage, and it carries a specific risk for databases.
An engine that demotes data during a quiet window can leave a hot partition sitting on cold media right before a report hits it, and the query pays the cold-read penalty. For predictable OLTP, explicit placement beats an algorithm's guess.
Partition by date or access pattern, pin the hot partitions and the log to NVMe, and let tiering manage only the data whose access you can afford to be wrong about.
The order of operations
Work the sequence from cheapest and safest toward largest, and stop when the numbers meet your target.
Where this leaves you
The slow disk rarely announces itself as a failure. It degrades a little each week, the overnight jobs finish later, and one morning the numbers other teams were counting on are simply not there. Adding more of the same disk buys a few weeks and defers the reckoning. The measurements in this guide let you find the real constraint and act on it before that morning arrives, instead of after.
The work here is diagnosis and sequencing, done in a specific order, defended with specific numbers. Confirm the bottleneck, fix the log placement first, and price the upgrade on transactions rather than gigabytes. That is a decision you can stand behind in any budget review.
When the fix does point to new hardware, the follow-on question is which flash platform is proven against your specific database and workload, and that is its own evaluation. Our complete guide to IT vendor selection and the essential vendor selection criteria and checklist walk that process so the platform you choose holds up under the load you actually run, not the one on the datasheet.
Considering Storage Vendors?
If your diagnosis points to new storage and you'd rather not rush the vendor decision, explore pre-vetted storage and infrastructure providers on TechnologyMatch. Build a shortlist matched to your workload and requirements, and open conversations when it suits you. It's free and private.
FAQ
How do I know if storage is my database bottleneck?
Run iostat -x 1 on Linux and watch two columns: await (average I/O latency in milliseconds) and %util (how busy the device is). When both are high together, the device is the constraint. When %iowait is high but await stays low, the problem is upstream in the query layer or application, not the disk. Confirm from the database side by checking the buffer cache hit ratio and transactions per second before spending on new hardware.
Is NVMe worth it over a SATA SSD for databases?
For concurrent transactional workloads, yes. NVMe uses up to 65,535 command queues versus SATA's single 32-command queue, so it keeps scaling as concurrency rises while SATA saturates near 95,000 IOPS. In MySQL TPC-C testing, NVMe delivered 3.8x more transactions per second and up to 22.4x better p999 latency. NVMe costs about 78% more per gigabyte but roughly 3.8x less per IOPS, which is the metric that matters for databases.
Should WAL or redo logs be on separate storage?
Yes. Write-ahead logs (PostgreSQL WAL, MySQL redo, Oracle redo) are sequential writes on the commit path, while data-file I/O is random. Sharing one device lets random reads stall every commit, which shows up as Oracle log file sync waits or MySQL redo contention. Moving the log to a dedicated low-latency volume often recovers more p99 latency than a full storage upgrade, at a fraction of the cost.
What is the difference between IOPS, throughput, and latency for databases?
IOPS measures discrete operations per second and matters for small random reads and writes typical of OLTP. Throughput (MB/s) measures bulk transfer rate and matters for analytics, backups, and large scans. Latency measures the time for a single operation and governs user-facing response times. For SLAs, track tail latency (p99 and p999) rather than the average, because the long tail is what produces timeouts users actually notice.
When does network-attached database storage stop making sense?
When I/O volume drives cost and latency past your targets. In PostgreSQL TPC-C benchmarks, local NVMe held a p99 roughly 1.9x lower than Aurora and 7.7x lower than RDS. On cost, about 2.5 million IOPS from a local NVMe drive runs around $600, while the same IOPS through a managed network service can reach $1.3 million per month. NVMe over Fabrics (NVMe-oF) is the middle path, extending low-latency NVMe across a network so you can separate storage and compute without the usual latency penalty.